Dr Jens-Arne Subke, Associate Professor in Biological and Environmental Sciences, Faculty of Natural Sciences, University of Stirling

The COVID-lockdown has changed the way we behave, with massive reductions in travel and other carbon-intensive activities. But what does the data reveal about the impact of this behaviour change on carbon emissions? Dr Jens-Arne Subke looks at the latest figures in the latest COVID-19 bite-sized lecture.
Watch the lecture online or read the transcript below.
Hello and welcome to my short lecture in which I would like to discuss some interactions between the COVID-19 epidemic, the lockdown that ensued, and how this relates to climate change and CO2 emissions.
Impact on carbon emissions
The lockdown that followed the COVID-19 epidemic across many countries has impacted the lives of virtually everyone on Earth. The requirement to stay at home for the majority of people has meant that the normal daily activities have altered completely, with massive disruptions, for example, of travel or factory outputs. Apart from the obvious severe economic impact, this has also reduced the demand on energy for surface transport, on fuel for aircraft and power demand for industry, as well as public buildings and offices.
A very recent paper in the journal Nature Climate Change has calculated the amount of reductions of CO2 emissions that followed the lockdown and the graphs here split this up by different sectors. As you can see, the surface transport on the top right here has caused the greatest reduction. The emissions savings we see here are in megatons of CO2 per day. Total emissions per day currently would normally be around 100 megatons of CO2. So you can read these individual contributions of the reductions practically as per cent. So we have about seven and a half per cent at the peak of the lock down in surface transport emission reductions.The bottom graphs have a slightly different scale, but aviation you can see reduced overall anthropogenic (human caused) emissions by around 1.5 to 2 percent.
Taken together, these reductions across all sectors at the peak of the lockdown were around 17 percent of what would otherwise be considered normal anthropogenic CO2 emissions. It’s worth noting that this reduction, even though it is substantial, drastic and very quick, has taken us back to a time when our emissions were at around that level of only around 14 to 15 years. So if you look at when we last had emissions equivalent of this 17 percent reduction, it doesn’t take us back many decades. It only takes us back to around to 2006, 2007. So that is a mark of the rate of growth that we’ve experienced since then.
This COVID epidemic, which is a significant challenge in itself, is happening in front of the backdrop of an arguably even bigger challenge, which is that of the climate emergency that we are in. So these reductions in CO2 emissions should be good news. They are obviously working in the right direction for climate protection and to tackle climate change in a meaningful way, we know that we have to adjust our behaviour, the way that we use energy, the way that we organise transport and so on.
The lockdown forced reduction of CO2 can be seen as a tester or a little taste of what may be to come in the future in the way that we operate.
Significance
For this talk, I would like to address the meaning of this reduction in additional emissions for the absolute amount of CO2 in the atmosphere, because there’s a difference between the rates of addition. So the rates of emissions that we have and the overall carbon dioxide that’s already in the atmosphere. I’d like to look at how that’s impacted and how that really figures in any efforts of reducing CO2 in the longer term. The point to start and create the context really is the Intergovernmental Panel for Climate Change report. The most recent one with figures is for 2013. There’s another one out next year, and it’s the most authoritative source of information on the global carbon cycle.
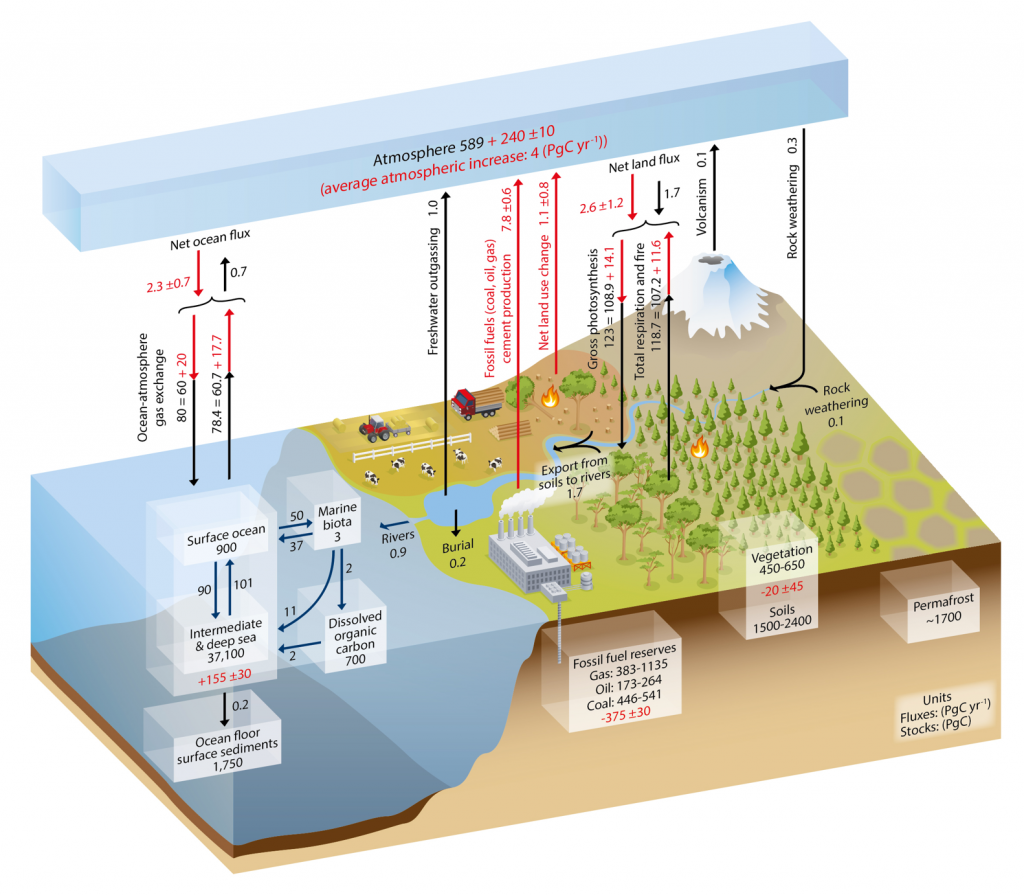
There is a lot of information in this graph. I’m focussing on the top half, that’s the emissions and the drawdown of CO2 to and from the atmosphere. On the right you can see the influence of the terrestrial biosphere, and on the left marine biosphere. If we look at the black figures first, ignoring the red arrows and numbers, they are the influence of photosynthesis as an uptake of CO2 from the atmosphere into the biosphere. On the other hand, we have arrows pointing upwards, that is the release of CO2 from natural processes in the biosphere; all the respiration, decomposition of organic matter and so on. Again, that’s separately for oceanic and for terrestrial systems. What is important is that in a pre-industrial era, these additions and reductions for the atmospheric CO2 were more or less balanced. So they would result in having a fairly constant CO2 concentration over many years.
In red, we have the influence of the man-made changes to atmospheric CO2 conditions, and with no surprises, there are increases in CO2 in the atmosphere from the burning of fossil fuels, cement production and also, importantly, the change in land use that occurs. We can see there is upward fluxes from these activities. What’s also important to note is that since we have had these increases in the atmospheric CO2 concentration, there has been a secondary impact also on the biospheric fluxes. If you look at the red arrows, what was previously a closely balanced system with a more or less zero balance between atmosphere and the biosphere is now a net sink to the biosphere. This is an important point to remember also for this talk that if we had no further manmade emissions from tomorrow, the biosphere would draw down CO2 from the atmosphere. It is acting as an active CO2 sink at present.
For the rest of the talk, what I would like to do is represent the CO2 in the atmosphere as the water levels of a swimming pool. I’m borrowing this imagery from colleagues in the Integrated Carbon Observation System. The volume of water in the pool is representative of the amount of CO2 in the atmosphere, and I’ve dimensioned my pool as 30 meters long, and six meters wide, so that the volume of 590 cubic meters, which represents the 590 petagrams of CO2 in the atmosphere, results in a water level of around 300 centimetres to represent the initial conditions. So if we have 590 cubic meters in our pool here, we’re just below 300 centimetres. I’ve chosen these dimensions because these numbers in centimetres are now representative of the concentration of the atmosphere where you may have heard the magic figure, 400 parts per million being critical of where we should be beneath in order to stabilise the climate.
Returning to the carbon cycle, there are additions to our CO2 pool in this swimming pool from all the respiratory activity, from plants, animals, microbes and so on, and that’s for terrestrial as well as marine. On the other hand, we’ve got an outflow from the pool where there’s an equivalent amount every year that leaves the pool, and that’s representative of the uptake of CO2 from the atmosphere into the biosphere. This then turns into the carbon cycle where that fixed carbon is used again by the heterotrophs and released.
So over the year, because there’s some seasonality, some offset between the uptake and the release, we would see a fluctuation in our water table up and down of only a few centimetres on the order of five centimetres. And remember, that represents about five parts per million over the course of a year. And that is exactly what measurements show. That’s a kind of fluctuation. Except we have a slightly different situation now for these large fluxes of CO2 into an out of the pool from natural causes, we have a seemingly quite small addition from our human activities – so, all the emissions from modern life add to it at a relatively slow rate. But, it happens year after year, it adds up and there is no mechanism of removing CO2 at the same rate. So therefore, we go from our initial five hundred and ninety cubic metres in the pool to a much higher water level. So, since the beginning of industrialisation up to now with a nine cubic metres per year, we’ve now 830 cubic metres in our pool, and it’s continuing to rise. And that’s exactly what it looks like.
This is a curve that I’ve calculated based on these fluxes for the water depth in the pool, but it looks very, very similar to what the atmospheric observations show in CO2 with seasonal changes up and down, but a net increase over time, increasing by between two and two and a half parts per million every year.
Now the COVID19 lock down is modelled here as the final year, if we imagine this happening at the beginning of 2020. For one year, we can see there is a reduction. It is less of an increase, in fact, we go from about to 2.2 centimetres increase year on year to only a 1.4 centimetre increase. But, it remains an increase. So the reduction CO2 emissions has not led to a reduction in CO2 contents in the atmosphere, it has simply slowed the increase. The reason that we don’t see a smaller reduction – so we go from 2.2 cm to 1.4 cm, so substantially more than a 17 percent reduction – the reason for that is that the biosphere soaks up quite a lot of the human emissions already. Remember, we’ve got the sink function and the biosphere removes some of the emissions so that 17 percent reduction in our emissions translates into a larger reduction.
Conclusions
So as take-home messages from this talk, the first point to notice is that the reduction in CO2 emissions because of the lockdown does not reverse the trend that we have in rising atmospheric CO2 emissions. It’s a continued increase, just at a slightly lower rate. Drastic changes in the way we use energy and the way we generate energy and the way that we organise our transport are needed and they have to exceed what’s already happened because of the COVID lockdown if we are to achieve net zero emissions.
In planning for net zero, the biospheric uptake of CO2, the sink function, is absolutely critical. It is not guaranteed that it’s a perpetual sink, there will be a saturation point reached, but at the moment the regrowth of many formerly cultivated lands means that we can, through restoration of ecosystems, achieve a continued sink function. That is part of any strategy of achieving net zero. We have to balance the needs of industrial activity, and the need for transport with other activities – managing land, for example, restoration of ecosystems and the way in which we produce crops.
Thank you very much.